


Chalkbeat continues its closer look today at recently released state test scores. The scores are one way to measure whether schools are doing a good job serving different groups of students, including students of color. This story focuses on students by race and ethnicity.
On the whole, black and Hispanic students in grades 3 through 8 scored lower on literacy and math tests taken this past spring than white students did. Those gaps have persisted for years in Colorado and across the nation.
But the raw scores don’t tell the whole story. While they show whether or not students are at grade level, they don’t show how much academic progress students made in the year leading up to taking the tests. Take, for instance, a fifth-grader who jumped from reading at a first-grade level to a fourth-grade level. The student made a lot of progress but still isn’t at grade level.
The state aims to measure such academic progress with something called a “growth percentile,” or growth score. State education officials have focused on growth scores as a better gauge of teaching and learning than raw test scores, which tend to be correlated to race or family income.
That’s why the state heavily weighs growth scores when assigning quality ratings to districts and schools. That’s also why we’re featuring them in the searchable database at the bottom of this story.
Growth scores work like this: Each student’s raw test score is compared with the scores of students who performed similarly to them in previous years. The growth score is a percentile: A 99 means a student did better than 99 percent of students with similar test score histories.
The state also calculates growth scores for entire districts, schools, and groups of students by ranking from highest to lowest all of their growth scores and then finding the midway point, or median, among the students.
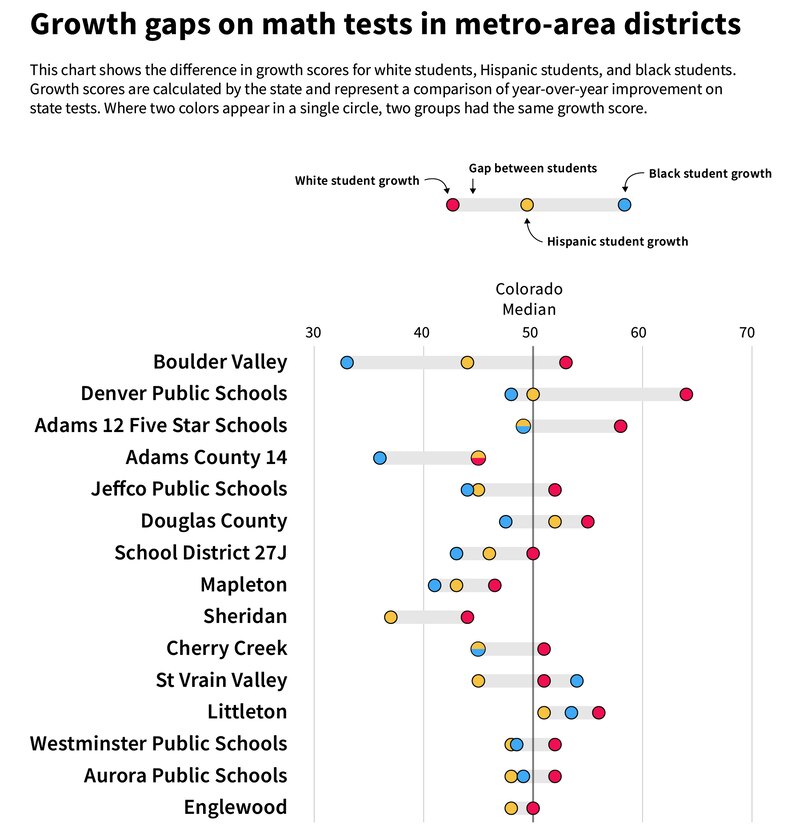
In the charts below, you’ll see median growth scores for 15 metro area districts. For each district, you’ll see three scores: One for black students, one for Hispanic students, and one for white students.
Including the scores of white students provides an indication of whether districts are serving students of color as well as they’re serving white students. Testing experts caution that growth scores are just one piece of the puzzle when measuring a school’s quality.
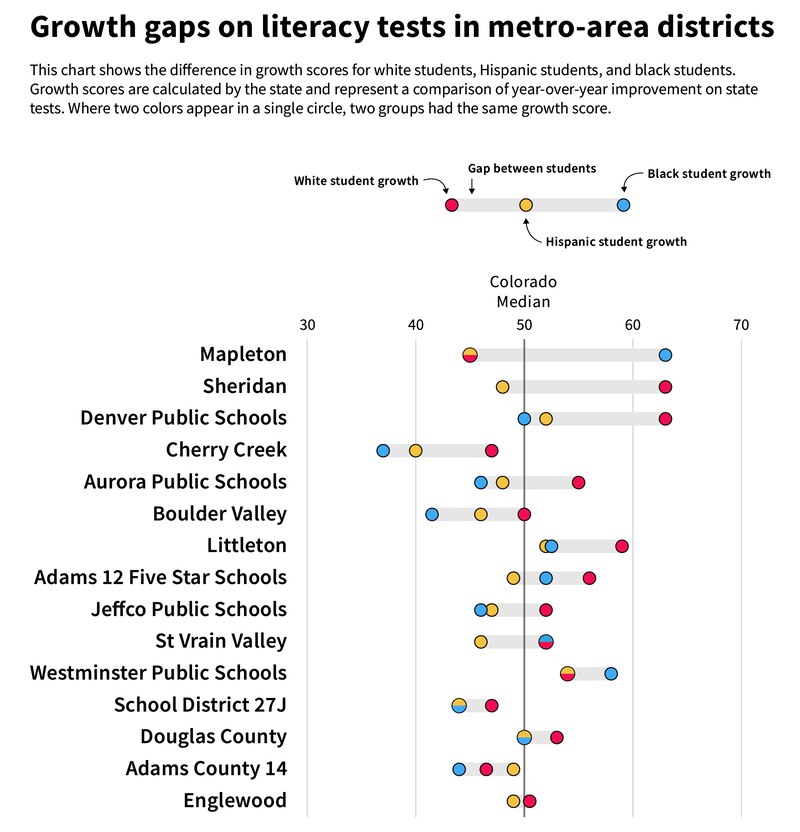
In most districts, white students showed more academic progress than black or Hispanic students did. But there were some exceptions. In the Mapleton school district, located north of Denver, black students showed far more progress in literacy than did white or Hispanic students. About 2 percent of the district’s nearly 9,000 students are black.
The database below goes even deeper to show median growth scores at all Colorado elementary and middle schools for black students, Hispanic students, and white students. Those three groups are the biggest in Colorado. We did not include growth scores for smaller groups of students, including Asian and Native American students, because of the technological limitations of our database and because Colorado’s student data privacy rules obscure many of the scores for those students.
A note about the numbers themselves: The median growth score for the state is always about 50. The state considers growth scores between 35 and 65 “typical,” meaning students made a typical amount of academic progress that year.
Scores higher than 65 suggest students are making above-average academic progress – evidence, perhaps, that a school’s curriculum is working for those students or their teachers are getting the training, support, and resources they need to be effective
Scores lower than 35 suggest the opposite.
Look up your elementary or middle school in the database below. The database also allows you to pull up several schools at once and see their scores side-by-side.
A “-” symbol means a score is not publicly available. The state obscures test results for small groups of students in what has been a controversial effort to protect student privacy.