
To prove that parents — and especially poor parents — approve of the changes that Mayor Bloomberg has brought to the schools, his administration often cites data collected by a group called the Community Service Society, which every year conducts a survey of low-income families called “The Unheard Third.” The troubling thing about this data is that it doesn’t exist anywhere on the Internet. (When I referred to it earlier today, I just plucked the figures Klein cites.)
Until now! Thanks to a spokeswoman at CSS who just called me back, I’ve got the numbers from all the surveys that asked a question about the school system since 2002. They tell a story that is encouraging, but less black and white than Klein has had it. “We don’t want to paint such a rosy picture that people say, ‘Oh, everything is good,’ because it truly is not,” the spokeswoman, Tracy Mumford, told me.
The data suggest that more parents gave the school system a high A or B grade on the survey in 2007 than did so in 2002: The number is up to 35% from 22%. Less encouragingly, the percentage of families who grade the system an F, 11%, is still higher than the percentage who grade it an A, 9%, and the F percentage has been climbing since 2005. C remains the most common grade by far, and the portion of parents grading the schools a C has actually risen since 2002, by one percentage point.
The figures also suggest that the path to higher satisfaction has been bumpy, with parent upset rising to a peak in 2005 — the same year Mayor Bloomberg won re-election. The result is that while the portion of parents giving D and F grades has fallen substantially since 2005, the change since 2002 is less dramatic.
Here’s one other way to look at the figures graphically, below the jump, plus a chart showing the raw numbers:
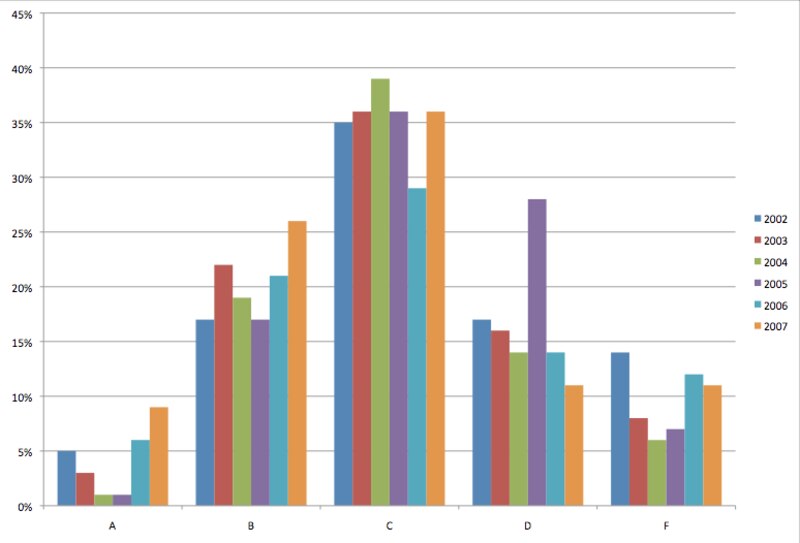
The raw numbers:
A B C D F 2002 5% 17% 35% 17% 14% 2003 3% 22% 36% 16% 8% 2004 1% 19% 39% 14% 6% 2005 1% 17% 36% 28% 7% 2006 6% 21% 29% 14% 12% 2007 9% 26% 36% 11% 11%